


Connecting Concepts
Use Science Graphics
The graph shows the levels of glucose in the blood of two people during a five-hour period immediately following the ingestion of a typical meal. Use the graph to answer questions 33 and 34.
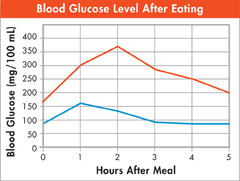
Interpret Graphs How long does it take the blood glucose level of the person represented by the blue line to return to a homeostatic value?
Draw Conclusions Which line represents a person who may have diabetes? Which line represents a person who does not have diabetes? Explain your answers.
Write About Science
Persuasion Anabolic steroids are synthetic versions of the hormone testosterone. Although anabolic steroids have important medical uses, they can damage the body if abused. Use library or Internet resources to find more information about anabolic steroids. Then, write an article for your school newspaper informing people of steroids' harmful effects. (Hint: Be sure to support your main ideas with specific details.)
Assess the
 Choose one of the endocrine glands and describe how that gland is involved in a feedback mechanism that maintains homeostasis.
Analyzing Data
These graphs show the number of multiple births since 1980. The first graph shows births of twins. The second graph shows multiple births consisting of three or more babies. Use the graphs to answer questions 37 and 38.
Interpret Graphs Which birth rate showed the greatest percentage increase from 1980 to 2005?
twins
triplets or more
They increased by the same percentage.
It's impossible to tell from the data.
Calculate Approximately how many times greater was the number of twin births compared with the number of births of triplets or more in the year 1995? (Hint: Note that the numbers on the y-axes are different scales.)
two times
ten times
fifteen times
twenty times
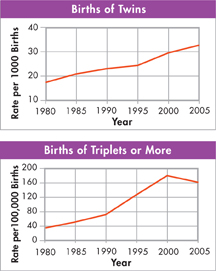
Table of Contents
- Formulas and Equations
- Applying Formulas and Equations
- Mean, Median, and Mode
- Estimation
- Using Measurements in Calculations
- Effects of Measurement Errors
- Accuracy
- Precision
- Comparing Accuracy and Precision
- Significant Figures
- Calculating With Significant Figures
- Scientific Notation
- Calculating With Scientific Notation
- Dimensional Analysis
- Applying Dimensional Analysis