


Technology & Biology
Global Ecology From Space
Can ecologists track plant growth around the world? Can they follow temperature change in oceans from day to day, or the amount of polar ice from year to year? Yes! Satellites can provide these data, essential for understanding global ecology. Satellite sensors can be programmed to scan particular bands of the electromagnetic spectrum to reveal global patterns of temperature, rainfall, or the presence of plants on land or algae in the oceans. The resulting false-color images are both beautiful and filled with vital information.
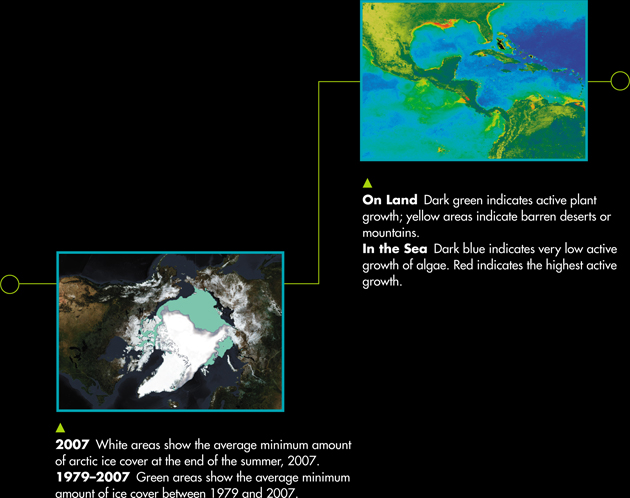
Changes in Polar Ice Cover Sea ice around the North Pole has been melting more each summer since satellites began gathering data in 1979. The image below shows in white the amount of ice remaining at the end of the summer in 2007. The amount of ice at the same time of year for an average year between 1979 and 2007 is shown in green.
Plant and Algal Growth These data were gathered by NASA's Sea-viewing Wide Field-of-view Sensor (SeaWiFS), which is programmed to monitor the color of reflected light. In the image below, you can see how actively plants on land and algae in the oceans were harnessing solar energy for photosynthesis when these data were taken. A measurement of photosynthesis gives a measure of growth rates and the input of energy and nutrients into the ecosystem.
WRITING
Visit the Web site for the Goddard Space Flight Center Scientific Visualization service and select a set of satellite data to examine. Write a brief paragraph explaining what you learned from looking at those data.
Table of Contents
- Formulas and Equations
- Applying Formulas and Equations
- Mean, Median, and Mode
- Estimation
- Using Measurements in Calculations
- Effects of Measurement Errors
- Accuracy
- Precision
- Comparing Accuracy and Precision
- Significant Figures
- Calculating With Significant Figures
- Scientific Notation
- Calculating With Scientific Notation
- Dimensional Analysis
- Applying Dimensional Analysis