


Connecting Concepts
Use Science Graphics
The following actual and projected data, from the United Nations Department of Economic and Social Affairs, Population Division, show when the global population reached or will reach an additional billion. Use the data table to answer questions 30 and 31.

Observe When did the world population reach 1 billion people? When did it reach 6 billion?
Interpret Tables Describe the trend in population growth since the 1-billion-people mark.
Write About Science
Explanation Write a paragraph on the human population. Include the characteristics of a population, factors that affect its size, and changes in the size of the population from about 500 years ago to the present. Give a projection of how large the world population might be in the year 2050 and of how the growth rate in 2050 might compare to that in 2000. (Hint: Outline your ideas before you begin to write.)
Assess the
 Choose a specific organism and explain how the population of that organism depends on a number of factors that may cause it to increase, decrease, or remain stable in size.
Analyzing Data
The following graph shows the “boom-and-bust” pattern of regular rises and falls in the rabbit population in South Australia. The points at which various population control measures were introduced are indicated. Use the graph to answer questions 34 and 35.
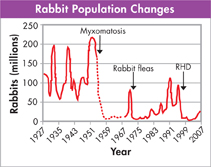
Interpret Graphs In which of the following years was the rabbit population density in South Australia most dense?
1936
1952
1975
2000
Infer European rabbit fleas were introduced in the late 1960s to help spread the effects of the rabbit disease myxomatosis. Based on the graph, what can you infer about the rabbit population after the fleas were introduced?
The rabbit birthrate increased.
The rabbit death rate increased.
The rabbit death rate decreased.
The fleas had no effect on the rabbit population.
Table of Contents
- Formulas and Equations
- Applying Formulas and Equations
- Mean, Median, and Mode
- Estimation
- Using Measurements in Calculations
- Effects of Measurement Errors
- Accuracy
- Precision
- Comparing Accuracy and Precision
- Significant Figures
- Calculating With Significant Figures
- Scientific Notation
- Calculating With Scientific Notation
- Dimensional Analysis
- Applying Dimensional Analysis