


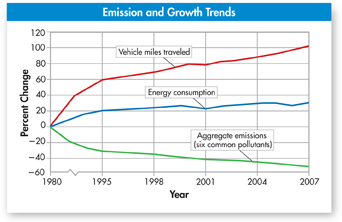
FIGURE 6–12 Air Pollution Trends This graph summarizes EPA findings of the total percentage change from 1980 to 2007 in vehicle miles traveled, energy consumption, and the combined emissions of six common pollutants—carbon monoxide, lead, nitrogen oxides, organic compounds, particulates, and sulfur dioxide. Calculate In 1980, motorists in the Puget Sound region of Washington State traveled 36.4 million miles. Assuming that these motorists increased their miles traveled at the national rate, approximately how many miles did they travel in 2007? 
Air Quality and Sustainability Improving air quality is difficult. Air doesn't stay in one place and doesn't “belong” to anyone. Automobile emission standards and clean-air regulations have improved air quality in some regions, however, and seem to be having a net positive effect, as shown in Figure 6–12. Efforts like these also have improved the atmosphere globally. At one time, for example, all gasoline was enriched with lead. But as leaded gasoline burned, lead was released in exhaust fumes and ultimately washed onto land and into rivers and streams. U.S. efforts to phase out leaded gasoline started in 1973 and were completed in 1996 when the sale of leaded gasoline was banned. Now that unleaded gasoline is used widely across the United States, lead levels in soils, rivers, and streams around the country have dropped significantly from earlier, higher levels.
6.2 Assessment

-
Review What causes soil erosion? Why is soil erosion a problem?
Apply Concepts What are three ways in which the agriculture and forestry industries can improve the sustainability of soil?
-
Review How is fresh water both a renewable and a limited resource?
Explain Why are some pollutants more harmful to organisms at higher trophic levels?
Propose a Solution Pick one source of water pollution and describe a way in which we can reduce its effect.
-
Review What ecological goods and services does the atmosphere provide?
Relate Cause and Effect How does the use of fossil fuels negatively impact Earth's atmosphere?
ANALYZING DATA
Look at Figure 6–8. If the concentration of DDT in zooplankton measures 0.04 parts per million, what is the approximate concentration of DDT at each other trophic level shown?

Table of Contents
- Formulas and Equations
- Applying Formulas and Equations
- Mean, Median, and Mode
- Estimation
- Using Measurements in Calculations
- Effects of Measurement Errors
- Accuracy
- Precision
- Comparing Accuracy and Precision
- Significant Figures
- Calculating With Significant Figures
- Scientific Notation
- Calculating With Scientific Notation
- Dimensional Analysis
- Applying Dimensional Analysis