


Connecting Concepts
Use Science Graphics
The graph shows the amount of bluefin tuna caught by the United States in the Atlantic Ocean between 2002 and 2006. Use the graph to answer questions 28 and 29.
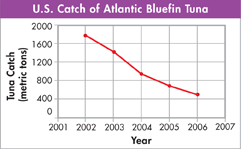
Predict What trend would you expect to see in the annual catch from 2006 to 2007?
Propose a Solution What recommendations would you make to help the bluefin tuna population recover in the next decade or two?
Write About Science
Explanation Write a paragraph explaining the value of wetlands to human societies. In your paragraph, include the concept of biodiversity as well as the role of wetlands in maintaining water resources for human use.
Assess the
 Why is it important to maintain species diversity in areas where humans live?
Assess the
What environmental factors make high levels of biodiversity possible in most coastal waters? Refer to the discussion of abiotic and biotic factors in Chapter 4 if you need help answering this question.
Analyzing Data
The following graph shows the number of species introduced to new habitats in the United States in the last century. Some of the species were relocated to new habitats within the United States while others were imported from other countries.
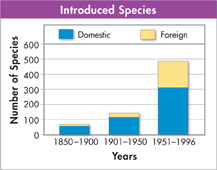
Interpret Graphs Of domestic species and foreign species, which showed the greatest percentage increase between the 1901–1950 period and the 1951–1996 period?
domestic species
foreign species
Both increased the same amount.
There is not enough information to tell.
Draw Conclusions Which of the following statements about introduced species is most likely true based on the data shown?
Species introduced from foreign countries are always more harmful than species relocated within the country.
All introduced species are brought into this country by accident.
It is likely that the increase in the number of introduced species is due to increased global travel, trade, and communication.
The number of introduced species is likely to fall in the next half-century.
Table of Contents
- Formulas and Equations
- Applying Formulas and Equations
- Mean, Median, and Mode
- Estimation
- Using Measurements in Calculations
- Effects of Measurement Errors
- Accuracy
- Precision
- Comparing Accuracy and Precision
- Significant Figures
- Calculating With Significant Figures
- Scientific Notation
- Calculating With Scientific Notation
- Dimensional Analysis
- Applying Dimensional Analysis