


Connecting Concepts
Use Science Graphics
A water plant placed under bright light gives off bubbles of oxygen. The table below contains the results of an experiment in which the distance from the light to the plant was varied. Use the data table to answer questions 30–33.
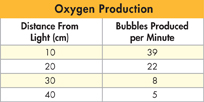
Graph Use the data in the table to make a line graph.

Interpret Graphs Describe the observed trend. How many bubbles would you predict if the light was moved to 50 cm away? Explain.
Draw Conclusions What relationship exists between the plant's distance from the light and the number of bubbles produced? What process is occuring? Explain your answer.
Apply Concepts Based on the results of this experiment, explain why most aquatic primary producers live in the uppermost regions of deep oceans, lakes, and ponds.
Write About Science
Creative Writing Imagine that you are an oxygen atom and two of your friends are hydrogen atoms. Together, you make up a water molecule. Describe the events and changes that happen to you and your friends as you journey through the light-dependent reactions and the Calvin cycle of photosynthesis. Include illustrations with your description.
Assess the
 In eukaryotic plants, chlorophyll is found only in chloroplasts. Explain how the function of chlorophyll is related to its very specific location in the cell.
Analyzing Data
An experimenter subjected corn plants and bean plants to different concentrations of carbon dioxide and measured the amount of CO2 taken up by the plants and used in photosynthesis. Data for the two plants are shown in the following graph.
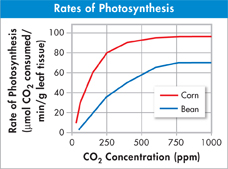
Interpret Graphs Bean plants reach their maximum rate of photosynthesis at what concentration of carbon dioxide?
about 50 ppm
about 200 ppm
about 750 ppm
1000 ppm
Draw Conclusions From the data it is possible to conclude that
beans contain more chlorophyll than corn contains.
corn reaches its maximum photosynthetic rate at lower concentrations than beans do.
beans reach their maximum photosynthetic rate at lower concentrations than corn does.
beans use carbon dioxide more efficiently than corn does.
Table of Contents
- Formulas and Equations
- Applying Formulas and Equations
- Mean, Median, and Mode
- Estimation
- Using Measurements in Calculations
- Effects of Measurement Errors
- Accuracy
- Precision
- Comparing Accuracy and Precision
- Significant Figures
- Calculating With Significant Figures
- Scientific Notation
- Calculating With Scientific Notation
- Dimensional Analysis
- Applying Dimensional Analysis