


Quick Lab
GUIDED INQUIRY
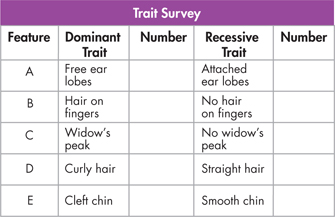
Classroom Variation
-
Copy the data table into your notebook.
-
Write a prediction of whether the traits listed in the table will be evenly distributed or if there will be more dominant than recessive traits.
-
Examine your features, using a mirror if necessary. Determine which traits you have for features A–E.
-
Interview at least 14 other students to find out which traits they have. Tally the numbers. Record the totals in each column.
Calculate Calculate the percentages of each trait in your total sample. How do these numbers compare to your prediction?

Form a Hypothesis Why do you think recessive traits are more common in some cases?
Analyze and Conclude
 In Your Notebook Make a diagram that explains Mendel's principle of dominance.
Segregation
 How are different forms of a gene distributed to offspring?
Mendel didn't just stop after crossing the parent plants, because he had another question: Had the recessive alleles simply disappeared, or were they still present in the new plants? To find out, he allowed all seven kinds of F1 hybrids to self-pollinate. The offspring of an F1 cross are called the F2 (second filial) generation. In effect, Mendel crossed the F1 generation with itself to produce the F2 offspring, as shown in Figure 11–4.
The F1 Cross When Mendel compared the F2 plants, he made a remarkable discovery: The traits controlled by the recessive alleles reappeared in the second generation. Roughly one fourth of the F2 plants showed the trait controlled by the recessive allele. Why, then, did the recessive alleles seem to disappear in the F1 generation, only to reappear in the F2 generation?
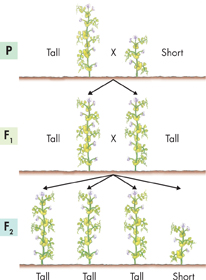
FIGURE 11–4 Results of the F1 Cross When Mendel allowed the F1 plants to reproduce by self-pollination, the traits controlled by recessive alleles reappeared in about one fourth of the F2 plants in each cross. Calculate What proportion of the F2 plants had a trait controlled by a dominant allele?
Table of Contents
- Formulas and Equations
- Applying Formulas and Equations
- Mean, Median, and Mode
- Estimation
- Using Measurements in Calculations
- Effects of Measurement Errors
- Accuracy
- Precision
- Comparing Accuracy and Precision
- Significant Figures
- Calculating With Significant Figures
- Scientific Notation
- Calculating With Scientific Notation
- Dimensional Analysis
- Applying Dimensional Analysis