


X-Chromosome Inactivation If just one X chromosome is enough for cells in males, how does the cell “adjust” to the extra X chromosome in female cells? The answer was discovered by the British geneticist Mary Lyon. In female cells, most of the genes in one of the X chromosomes are randomly switched off, forming a dense region in the nucleus known as a Barr body. Barr bodies are generally not found in males because their single X chromosome is still active.
The same process happens in other mammals. In cats, for example, a gene that controls the color of coat spots is located on the X chromosome. One X chromosome may have an allele for orange spots and the other X chromosome may have an allele for black spots. In cells in some parts of the body, one X chromosome is switched off. In other parts of the body, the other X chromosome is switched off. As a result, the cat's fur has a mixture of orange and black spots, like those in Figure 14–6. Male cats, which have just one X chromosome, can have spots of only one color. Therefore, if the cat's fur has three colors—white with orange and black spots, for example—you can almost be certain that the cat is female.
 In Your Notebook Write three quiz questions about the transmission of human traits and answer them.
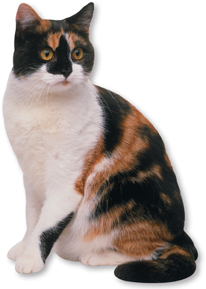
FIGURE 14–6 X-Chromosome Inactivation Female calico cats are tri-colored. The color of spots on their fur is controlled by a gene on the X chromosome. Spots are either orange or black, depending on which X chromosome is inactivated in different patches of their skin.
Human Pedigrees
 How can pedigrees be used to analyze human inheritance?
Given the complexities of genetics, how would you go about determining whether a trait is caused by a dominant or recessive allele and whether the gene for that trait is autosomal or sex-linked? The answers, not surprisingly, can be found by applying Mendel's basic principles of genetics.
To analyze the pattern of inheritance followed by a particular trait, you can use a chart that shows the relationships within a family. Such a chart is called a pedigree. A pedigree shows the presence or absence of a trait according to the relationships between parents, siblings, and offspring. It can be used for any species, not just humans.
The pedigree in Figure 14–7 shows how one human trait—a white lock of hair just above the forehead—passes through three generations of a family. The allele for the white forelock trait is dominant. At the top of the chart is a grandfather who had the white forelock trait. Two of his three children inherited the trait. Three grandchildren have the trait, but two do not.
BUILD Vocabulary
WORD ORIGINS The word pedigree combines the Latin words pedem, meaning “foot,” and gruem, meaning “crane.” A crane is a long-legged waterbird. On old manuscripts, a forked sign resembling a crane's footprint indicated a line of ancestral descent.

Table of Contents
- Formulas and Equations
- Applying Formulas and Equations
- Mean, Median, and Mode
- Estimation
- Using Measurements in Calculations
- Effects of Measurement Errors
- Accuracy
- Precision
- Comparing Accuracy and Precision
- Significant Figures
- Calculating With Significant Figures
- Scientific Notation
- Calculating With Scientific Notation
- Dimensional Analysis
- Applying Dimensional Analysis