


Connecting Concepts
Use Science Graphics
The following graph shows the total amount of product from a chemical reaction performed at three different temperatures. The same enzyme was involved in each case. Use the graph to answer questions 33–35.
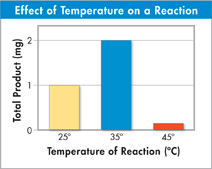
Interpret Graphs At which temperature was the greatest amount of product formed?
Draw Conclusions Describe the results of each reaction. How can you explain these results?
Predict A student performs the same chemical reaction at 30°C. Approximately how much product can she expect to obtain?
Write About Science
Explanation Write a paragraph that includes the following:
- (a) a description of the four major classes of organic compounds found in living things, and (b) a description of how these organic compounds are used by the human body.
Assess the  What properties of carbon allow it to play such a major role in the chemistry of living things?
Analyzing Data
A student measured the pH of water from a small pond at several intervals throughout the day. Use the graph to answer questions 38 and 39.
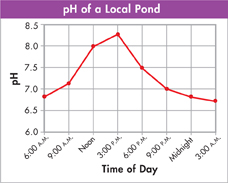
Interpret Graphs At what time of day is the pond most acidic?
between noon and 6:00 P.M.
at noon
between midnight and 6:00 A.M.
at 6:00 P.M.
Form a Hypothesis Which of the following is the most reasonable hypothesis based on the results obtained?
Pond water maintains constant pH throughout the day.
pH rises with increasing daylight and falls with decreasing daylight.
Living things cannot survive in this pond because enzymes will be destroyed.
pH is higher at night than during the day.
Table of Contents
- Formulas and Equations
- Applying Formulas and Equations
- Mean, Median, and Mode
- Estimation
- Using Measurements in Calculations
- Effects of Measurement Errors
- Accuracy
- Precision
- Comparing Accuracy and Precision
- Significant Figures
- Calculating With Significant Figures
- Scientific Notation
- Calculating With Scientific Notation
- Dimensional Analysis
- Applying Dimensional Analysis