


Connecting Concepts
Use Science Graphics
The chart below shows the relative numbers of species in four groups of vertebrates over time. The thickness of each band shows the relative number of species in that group. Use the chart to answer questions 27–30.
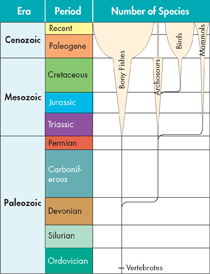
Compare and Contrast How is this kind of diagram similar to a traditional cladogram? What additional information can be learned from it?
Interpret Visuals Which of the groups shown has the greatest number of species today?
Infer Archosaurs are a group of reptiles that includes the dinosaurs, pterosaurs, modern crocodiles, and birds. Why do you think that birds are shown separately from the other archosaurs in the diagram?
Apply Concepts Describe the trend for each group shown from the beginning of the Mesozoic to today. Which groups were affected by the mass extinction at the end of the Mesozoic? Which groups have experienced adaptive radiations?
Write About Science
Explanation Write a paragraph in which you describe, in your own words, what the first animals were like.
Description In a paragraph, describe in your own words when the dinosaurs went extinct and what events contributed to the extinction.
Explanation Why is it important to estimate the age of a hominine fossil as well as to analyze its structural characteristics?
Assess the
 Life on Earth began in water. What were some of the major adaptations that animals evolved that allowed them to survive out of water?
Analyzing Data
Living members of the reptile clade include more than 8000 species of reptiles and about 10,000 species of birds. Review the data in the table and respond to the following.
Graph Construct a circle graph that presents the data in the table.
Evaluate What was your biggest challenge in representing these data in a circle graph?
Analyze Data Consider other methods of graphing data. Which type of graph might represent these data in a more helpful way?
Graph Graph these data using a method you would consider more helpful to a reader or explain why none would be.
Table of Contents
- Formulas and Equations
- Applying Formulas and Equations
- Mean, Median, and Mode
- Estimation
- Using Measurements in Calculations
- Effects of Measurement Errors
- Accuracy
- Precision
- Comparing Accuracy and Precision
- Significant Figures
- Calculating With Significant Figures
- Scientific Notation
- Calculating With Scientific Notation
- Dimensional Analysis
- Applying Dimensional Analysis