


Think Critically
Form a Hypothesis Ecologists discovered that trout were dying in a stream that ran through some farmland where nitrogen fertilizer was used on the crops. How might you explain what happened?
Apply Concepts Using a flowchart, trace the flow of energy in a simple marine food chain. Then, show where nitrogen is cycled through the chain when the top-level carnivore dies and is decomposed.
Connecting Concepts
Use Science Graphics
The graph below shows the effect of annual rainfall on the rate of primary productivity in an ecosystem. Use the graph to answer questions 27–29.
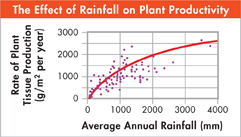
Interpret Graphs What happens to productivity as rainfall increases?
Predict What do you think the graph would look like if the x-axis were extended out to 6000 mm? Represent your prediction in a graph and explain your answer.
Apply Concepts What factors other than water might affect primary productivity?
Write About Science
Explanation Write a paragraph that (1) names and defines the levels of organization that an ecologist studies; (2) identifies the level that you would choose to study if you were an ecologist; (3) describes the method or methods you would use to study this level; and (4) gives a reason for your choice of method or methods.
Description Describe how biogeochemical cycles provide organisms with the raw materials necessary to synthesize complex organic compounds. Refer back to Chapter 2 for help in answering this question.
Assess the
 Explain how an element like carbon can be included in both the biotic and abiotic factors of an ecosystem.
Interpret Tables Which of the following is the best description of what happens to the amount of available oxygen as you get deeper in the ocean?
Available oxygen decreases at a constant rate.
Available oxygen increases at a constant rate.
Available oxygen remains steady until about 100 m, then drops rapidly.
Oxygen is available at all ocean depths.
Draw Conclusions Light can penetrate to only a depth of between 50 and 100 m in most ocean water. What effect does this have on the water's oxygen concentration? Explain.
Analyzing Data
Samples of ocean water are taken at different depths, and the amount of oxygen in the water at each depth is measured. The results are shown in the table.
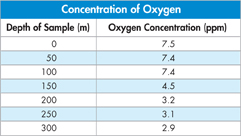
Table of Contents
- Formulas and Equations
- Applying Formulas and Equations
- Mean, Median, and Mode
- Estimation
- Using Measurements in Calculations
- Effects of Measurement Errors
- Accuracy
- Precision
- Comparing Accuracy and Precision
- Significant Figures
- Calculating With Significant Figures
- Scientific Notation
- Calculating With Scientific Notation
- Dimensional Analysis
- Applying Dimensional Analysis