


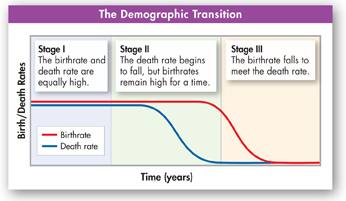
FIGURE 5–12 The Demographic Transition Human birthrates and death rates are high for most of history (Stage I). Advances in nutrition, sanitation, and medicine lead to lower death rates. Birthrates remain high for a time, so births greatly exceed deaths (Stage II), and the population increases exponentially. As levels of education and living standards rise, families have fewer children and the birthrate falls (Stage III), and population growth slows. The demographic transition is complete when the birthrate meets the death rate, and population growth stops.
dThe Demographic Transition Human societies had equally high birthrates and death rates during most of history. But over the past century, population growth in the United States, Japan, and much of Europe slowed dramatically. Demographers developed a hypothesis to explain this shift. According to this hypothesis, these countries have completed the demographic transition, a dramatic change from high birthrates and death rates to low birthrates and death rates. The demographic transition is divided into three stages, as shown in Figure 5–12.
To date, the United States, Japan, and Europe have completed the demographic transition. Parts of South America, Africa, and Asia are passing through Stage II. (The United States passed through Stage II between 1790 and 1910.) A large part of ongoing human population growth is happening in only ten countries, with India and China in the lead. Globally, human population is still growing rapidly, but the rate of growth is slowing down. Our J-shaped growth curve may be changing into a logistic growth curve.
Age Structure and Population Growth To understand population growth in different countries, we turn to age-structure diagrams. Figure 5–13 compares the age structure of the U.S. population with that of Guatemala, a country in Central America. In the United States, there are nearly equal numbers of people in each age group. This age structure predicts a slow but steady growth rate for the near future. In Guatemala, on the other hand, there are many more young children than teenagers, and many more teenagers than adults. This age structure predicts a population that will double in about 30 years.
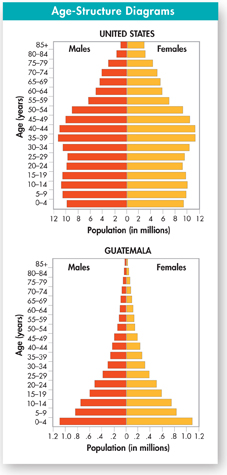
FIGURE 5–13 Comparison of Age Structures These diagrams compare the populations of the United States and Guatemala. Notice the difference in their x-axis scales. Analyze Data How do the two countries differ in the percentages of 10–14-year-olds in their populations?
dTable of Contents
- Formulas and Equations
- Applying Formulas and Equations
- Mean, Median, and Mode
- Estimation
- Using Measurements in Calculations
- Effects of Measurement Errors
- Accuracy
- Precision
- Comparing Accuracy and Precision
- Significant Figures
- Calculating With Significant Figures
- Scientific Notation
- Calculating With Scientific Notation
- Dimensional Analysis
- Applying Dimensional Analysis