


Connecting Concepts
Use Science Graphics
Use the graph to answer questions 32–34.
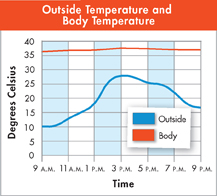
Interpret Graphs At what time of day is the body temperature closest to that of the outside environment?
Draw Conclusions What is the relationship between body temperature and the temperature of the environment?
Infer How do you explain the shape of the graph for body temperature?
Write About Science
Explanation Discuss how cephalization and segmentation have helped animals achieve such great diversity.
Assess the
 If you were presented with a small, living organism, how would you try to determine whether it was an animal?
Analyzing Data
The human digestive system converts food into glucose, a sugar that the body can use for energy. The following data were collected by taking a sample of blood from a person at various times during the day and measuring the relative volume of glucose in the blood.

Interpret Tables During which time interval is it most likely that this person ate a meal?
9 A.M. to 10 A.M.
10 A.M. to 11 A.M.
1 P.M. to 2 P.M.
2 P.M. to 3 P.M.
Infer Which value in the table would you expect to be closest to the homeostatic value for the amount of glucose in the blood?
Apply Concepts Explain how feedback inhibition might be involved in the changing levels of glucose in the blood.
Table of Contents
- Formulas and Equations
- Applying Formulas and Equations
- Mean, Median, and Mode
- Estimation
- Using Measurements in Calculations
- Effects of Measurement Errors
- Accuracy
- Precision
- Comparing Accuracy and Precision
- Significant Figures
- Calculating With Significant Figures
- Scientific Notation
- Calculating With Scientific Notation
- Dimensional Analysis
- Applying Dimensional Analysis