


Trophic Levels and Ecological Pyramids
 What do the three types of ecological pyramids illustrate?
Each step in a food chain or food web is called a trophic level. Primary producers always make up the first trophic level. Various consumers occupy every other level. One way to illustrate the trophic levels in an ecosystem is with an ecological pyramid. Ecological pyramids show the relative amount of energy or matter contained within each trophic level in a given food chain or food web. There are three different types of ecological pyramids: pyramids of energy, pyramids of biomass, and pyramids of numbers.
 In Your Notebook Make a two- column chart to compare the three types of ecological pyramids.
Analyzing Data
The 10 Percent Rule
As shown in Figure 3–11, an energy pyramid is a diagram that illustrates the transfer of energy through a food chain or food web. In general, only 10 percent of the energy available in one level is stored in the level above. Look at Figure 3–11 and answer the questions below.
Calculate If there are 1000 units of energy available at the producer level of the energy pyramid, approximately how many units of energy are available to the third-level consumer?

Interpret Diagrams What is the original source of the energy that flows through most ecosystems? Why must there be a continuous supply of energy into the ecosystem?
Infer Why are there usually fewer organisms in the top levels of an energy pyramid?
Pyramids of Energy Theoretically, there is no limit to the number of trophic levels in a food web or the number of organisms that live on each level. But there is one catch. Only a small portion of the energy that passes through any given trophic level is ultimately stored in the bodies of organisms at the next level. This is because organisms expend much of the energy they acquire on life processes, such as respiration, movement, growth, and reproduction. Most of the remaining energy is released into the environment as heat—a byproduct of these activities. Pyramids of energy show the relative amount of energy available at each trophic level of a food chain or food web.
The efficiency of energy transfer from one trophic level to another varies. On average, about 10 percent of the energy available within one trophic level is transferred to the next trophic level, as shown in Figure 3–11. For instance, one tenth of the solar energy captured and stored in the leaves of grasses ends up stored in the tissues of cows and other grazers. One tenth of that energy—10 percent of 10 percent, or 1 percent of the original amount—gets stored in the tissues of humans who eat cows. Thus, the more levels that exist between a producer and a given consumer, the smaller the percentage of the original energy from producers that is available to that consumer.
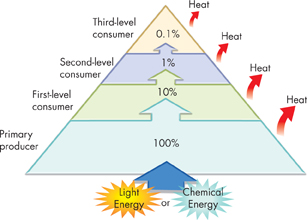
Figure 3–11 Pyramid of Energy Pyramids of energy show the relative amount of energy available at each trophic level. An ecosystem requires a constant supply of energy from photosynthetic or chemosynthetic producers.
Apply Concepts Explain how the amount of energy available at each trophic level often limits the number of organisms that each level can support.
ddTable of Contents
- Formulas and Equations
- Applying Formulas and Equations
- Mean, Median, and Mode
- Estimation
- Using Measurements in Calculations
- Effects of Measurement Errors
- Accuracy
- Precision
- Comparing Accuracy and Precision
- Significant Figures
- Calculating With Significant Figures
- Scientific Notation
- Calculating With Scientific Notation
- Dimensional Analysis
- Applying Dimensional Analysis