


Pyramids of Biomass and Numbers The total amount of living tissue within a given trophic level is called its biomass. Biomass is usually measured in grams of organic matter per unit area. The amount of biomass a given trophic level can support is determined, in part, by the amount of energy available.  A pyramid of biomass illustrates the relative amount of living organic matter available at each trophic level in an ecosystem.
Ecologists interested in the number of organisms at each trophic level uses a pyramid of numbers. A pyramid of numbers shows the relative number of individual organisms at each trophic level in an ecosystem. In most ecosystems, the shape of the pyramid of numbers is similar to the shape of the pyramid of biomass for the same ecosystem. In this shape, the numbers of individuals on each level decrease from the level below it. To understand this point more clearly, imagine that an ecologist marked off several square meters in a field, and then weighed and counted every organism in that area. The result might look something like the pyramid in Figure 3–12.
In some cases, however, consumers are much less massive than organisms they feed upon. Thousands of insects may graze on a single tree, for example, and countless mosquitos can feed off a few deer. Both the tree and deer have a lot of biomass, but they each represent only one organism. In such cases, the pyramid of numbers may be turned upside down, but the pyramid of biomass usually has the normal orientation.
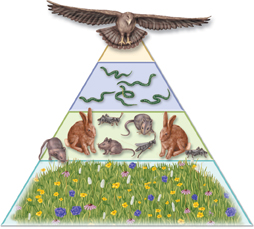
Figure 3–12 Pyramids of Biomass and Numbers In most cases, pyramids of biomass and numbers follow the same general pattern. In the field modeled here, there are more individual primary producers than first-level consumers. Likewise, the primary producers collectively have more mass. The same patterns hold for the second and third-level consumers. With each step to a higher trophic level, biomass and numbers decrease.
d3.3 Assessment
-
Review Energy is said to flow in a “one-way stream” through an ecosystem. In your own words, describe what that means.
Form a Hypothesis Explain what you think might happen to the Everglades ecosystem shown in Figure 3–9 if there were a sudden decrease in the number of crayfish.
-
Review On average, what proportion of the energy in an ecosystem is transferred from one trophic level to the next? Where does the rest of the energy go?
Calculate Draw an energy pyramid for a five-step food chain. If 100 percent of the energy is available at the first trophic level, what percentage of that energy is available at the highest trophic level?

Apply the Big idea
Refer to Figure 3–9, which shows a food web in the Everglades. Choose one of the food chains within the web. Then, write a paragraph describing the feeding relationships among the organisms in the food chain.

Table of Contents
- Formulas and Equations
- Applying Formulas and Equations
- Mean, Median, and Mode
- Estimation
- Using Measurements in Calculations
- Effects of Measurement Errors
- Accuracy
- Precision
- Comparing Accuracy and Precision
- Significant Figures
- Calculating With Significant Figures
- Scientific Notation
- Calculating With Scientific Notation
- Dimensional Analysis
- Applying Dimensional Analysis