Data Analysis
Faster Than Speeding Data
A modem is a device used to send and receive data. For example, if you upload an image to a Web site, the modem in your computer converts the data of the image into a different format. The converted data are then sent through a telephone line or cable TV line. The smallest unit of data that can be read by a computer is a binary digit, or “bit.” A bit is either a 0 or a 1. Computers process bits in larger units called bytes. A byte is a group of eight bits.
The table shows the data transfer rates for modems used in home computers. Data transfer rates are often measured in kilobits per second, or kbps. The time required to upload a 1-megabyte (MB) file is given for each rate listed.
Type of Modem |
Data Transfer Rate (kbps) |
Upload Time for 1 MB (s) |
|---|---|---|
56K dial-up |
48 |
167 |
Cable (low-speed) |
384 |
21 |
DSL (medium-speed) |
512 |
16 |
DSL (high-speed) |
768 |
10 |
Cable (high-speed) |
2000 |
4 |
Using Graphs Use the data in the table to create a line graph. Describe the relationship between data transfer rate and upload time.
Inferring How would doubling the data transfer rate affect the upload time?

Bar Graphs
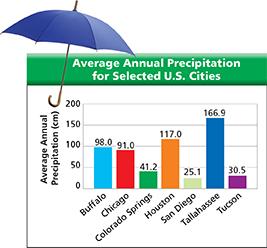
A bar graph is often used to compare a set of measurements, amounts, or changes. Figure 23 is a bar graph of the data from Figure 20. The bar graph makes it easy to see how the data for one city compare with the data for another.
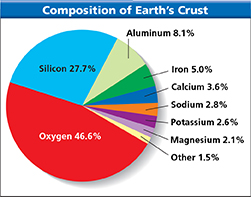
Circle Graphs
If you think of a pie cut into pieces, you have a mental model of a circle graph. A circle graph is a divided circle that shows how a part or share of something relates to the whole. Figure 24 is a circle graph that describes the composition of Earth's crust. The entire circle represents the mass of Earth's crust. Each “slice” of the circle represents a percentage of that mass corresponding to a specific substance.