


Charles's Law
During his lifetime, the French physicist Jacques Charles (1746—1823) was known for his inventions, including the hydrogen balloon. Today, Charles is best known for his investigations of the behavior of gases. Charles collected data on the relationship between the temperature and volume of gases. When he graphed the data, the graph was a straight line, as shown in Figure 13. The graph shows that the volume of a gas increases at the same rate as the temperature of the gas.
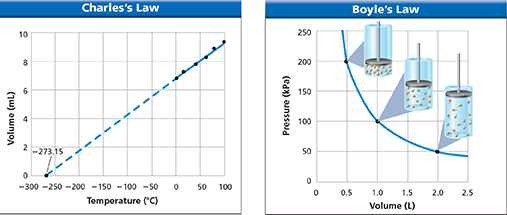
Figure 13 These graphs compare the effects of temperature and volume on the pressure of a gas. Charles's law describes the direct relationship between the temperature and the volume. Boyle's law describes the inverse relationship between the volume and the pressure.
Controlling Variables For each graph, name the manipulated variable and the responding variable.
 d
dCharles extended the line on his graph beyond the measured data to see what the temperature would have to be to produce a volume of 0 L. The temperature at the point where the line crossed the x-axis was —273.15°C. This temperature is equal to 0 K on the Kelvin temperature scale. A temperature of 0 K is called absolute zero. No scientist has produced a temperature of absolute zero in a laboratory, but some have come extremely close. As a gas cools to temperatures near 0 K, the gas changes to a liquid, a solid, or sometimes a Bose-Einstein condensate.
Charles's law states that the volume of a gas is directly proportional to its temperature in kelvins if the pressure and the number of particles of the gas are constant. Charles's law can be written as a mathematical expression in which T1 and V1 represent the temperature and volume of a gas before a change occurs. T2 and V2 represent the temperature and volume after a change occurs.
The temperatures must be expressed in kelvins. If temperatures in degrees Celsius are used in the expression, the volume will not be directly proportional to the temperature.