Speed-Time Graphs
The skier's speed increased at a constant rate because the skier was moving down the hill with constant acceleration. Constant acceleration is represented on a speed–time graph by a straight line. The graph in Figure 16 is an example of a linear graph, in which the displayed data form straight-line parts. The slope of the line is the acceleration.
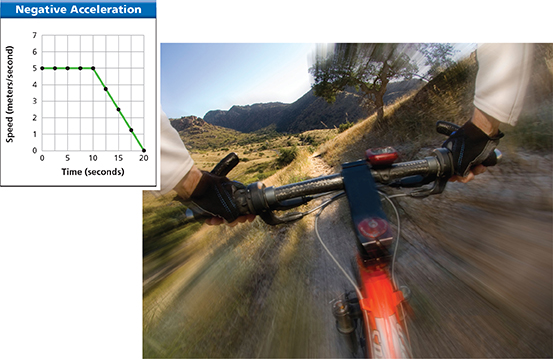
Constant negative acceleration decreases speed. A speed-time graph of the motion of a bicycle slowing to a stop is shown in Figure 17. The horizontal line segment represents constant speed. The line segment sloping downward represents the bicycle slowing down. The change in speed is negative, so the slope of the line is negative.
Figure 16 The slope of a speed time graph indicates acceleration. A positive slope shows that the skier's acceleration is positive.
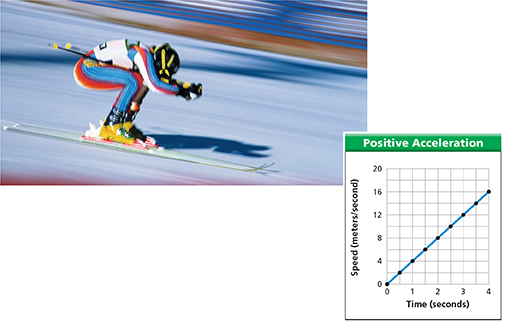
Figure 17 The horizontal part of the graph shows a biker's constant speed. The part of the graph with negative slope shows negative acceleration as the mountain biker slows to a stop.