


Hubble also found that more-distant galaxies have greater red shifts. This larger shift means that distant galaxies are moving away from Earth faster than closer galaxies. This relationship, called Hubble's Law, says that the speed at which a galaxy is moving away is proportional to its distance from us. The most distant observed galaxies are moving away at more than 90 percent of the speed of light!
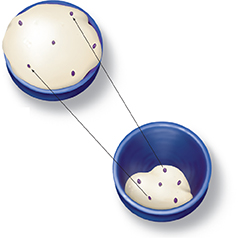
To visualize the movement of galaxies, imagine the dough for a loaf of raisin bread as it rises. The raisins represent individual galaxies or groups of galaxies, and the dough represents the universe. As shown in Figure 25, when the dough rises, the distance between raisins increases, but the raisins stay the same size. As the dough expands, the distance between raisins that are far apart increases more than the distance between nearby raisins. In the same way, the most distant galaxies are moving away from us more quickly.
 The observed red shift in the spectra of galaxies shows that the universe is expanding. Like the dough between the raisins, the space between the galaxies is expanding in all directions, and the universe as a whole is becoming larger.

What is Hubble's Law?
Figure 25 The raisins in this rising bread dough are all moving away from one another as the dough expands. In a similar way, galaxies move away from one another as the universe expands.
Data Analysis
Hubble's Constant
Hubble's law expresses the relationship between the velocity that a galaxy is moving away from Earth and its distance from us. The ratio of these variables is a constant called Hubble's constant. Hubble's constant can be estimated by finding the slope of a graph of velocity versus distance for a set of galaxies. Data for six galaxies are provided in the table at the right.
Hubble's constant is one of the most important and debated numbers in astronomy. It expresses how fast the universe is expanding, and can be used to estimate the age of the universe.
Using Tables Which galaxy is moving away the fastest? Which galaxy is closest to Earth?
Graphing Graph the data shown in the table. Place velocity on the vertical axis and distance on the horizontal axis. What is the general shape of the graph?
Velocity and Distance of Galaxies
Galaxy
Velocity (km/s)
Distance (x 106 light-years)
1
4,200
200
2
7,800
390
3
10,500
520
4
17,000
850
5
21,000
1110
6
24,000
1170
Calculating Estimate Hubble's constant by measuring the slope of your graph. (Hint: Draw a line through the data points. Recall that .)
Inferring About how fast is a galaxy receding if its distance is light-years? (Hint: Use your estimate of Hubble's constant from Question 3.)
Predicting Use your value for Hubble's constant to estimate the distance of a galaxy that has a velocity of 30,000 km/s.