


Instantaneous Speed
Average speed is useful because it lets you know how long a trip will take. Sometimes however, such as when driving on the highway, you need to know how fast you are going at a particular moment. The car's speedometer gives your instantaneous speed. Instantaneous speed, v, is the rate at which an object is moving at a given moment in time. For example, you could describe the instantaneous speed of the car in Figure 6 as 55 km/h.
Figure 6 The speedometer in a car measures the car's instant-aneous speed. Note the scale markings are given both in km/h and miles per hour, mph.
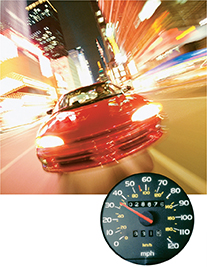

What does a car's speedometer measure?
Graphing Motion
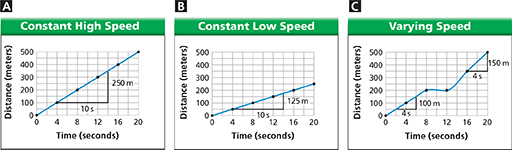
A distance-time graph is a good way to describe motion. Figure 7 shows distance-time graphs for the motion of three cars. Recall that slope is the change in the vertical axis value divided by the change in the horizontal axis value. On these graphs, the slope is the change in the distance divided by the change in time.  The slope of a line on a distance-time graph is speed. In Figure 7A, the car travels 500.0 meters in 20.0 seconds, or 25.0 meters per second. In Figure 7B, another car travels 250.0 meters in 20.0 seconds at a constant speed. The slope of the line is 250.0 meters divided by 20.0 seconds, or 12.5 meters per second. Notice that the line for the car traveling at a higher speed is steeper. A steeper slope on a distance-time graph indicates a higher speed.
Figure 7C shows the motion of a car that is not traveling at a constant speed. This car travels 200.0 meters in the first 8.0 seconds. It then stops for 4.0 seconds, as indicated by the horizontal part of the line. Next the car travels 300.0 meters in 8.0 seconds. The times when the car is gradually increasing or decreasing its speed are shown by the curved parts of the line. The slope of the straight portions of the line represent periods of constant speed. Note that the car's speed is 25 meters per second during the first part of its trip and 38 meters per second during the last part of its trip.
Figure 7 The slope of the line on a distance–time graph indicates the speed of the object. Using Graphs If the car in Figure 7A required less time to travel a given distance, how would the slope change?
 d
d