


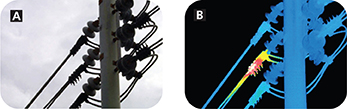
Figure 12 A thermogram can be used to diagnose problems in a utility line. A When viewed in visible light, the wires all look the same. B The colors in the thermogram image show that the electric current in the center wire is not flowing as it should.
Infrared Rays
Infrared rays have higher frequencies than radio waves and lower frequencies than red light. Infrared wavelengths vary from about 1 millimeter to about 750 nanometers. (A nanometer is 10—9 meters, or one millionth of a millimeter.)  Infrared rays are used as a source of heat and to discover areas of heat differences.

You cannot see infrared radiation, but your skin senses it as warmth. Reptile habitats at zoos are often kept warm with infrared lamps. Restaurants use infrared lamps to keep buffet-style foods at a safe temperature for consumption.
Warmer objects give off more infrared radiation than cooler objects. A device called a thermograph uses infrared sensors to create thermograms. Thermograms (THUR moh gramz) are color-coded pictures that show variations in temperature. They are used to find places where a building loses heat to the environment. Thermograms can also locate problems in the path of electric current, as shown in Figure 12.
The human body is usually warmer than its surroundings. After a natural disaster such as an earthquake, search-and-rescue teams use infrared cameras to locate victims quickly—even underground.
Visible Light
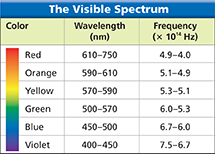
The visible part of the electromagnetic spectrum is light that the human eye can see. Each wavelength in the visible spectrum corresponds to a specific frequency and has a particular color. Figure 13 shows the wavelength and frequency ranges of different colors of light in a vacuum.
People use visible light to see, to help keep them safe, and to communicate with one another. Light enables people to read. It is what makes flowers, boxes, signs, and all other objects visible. Automobiles have headlights and taillights that make night driving safer. Traffic lights communicate information to drivers about what is expected of them—to stop, for example, when the light is red.

What is the visible part of the electromagnetic spectrum?
Figure 13 Each color of light corresponds to a different range of wavelengths. The wavelengths of visible light are quite small. Wavelengths of red light, for example, are about one hundredth the thickness of a human hair. Using Tables As the wavelength decreases from the red end of the spectrum to the violet end, what happens to the frequency?
 d
d