


Figure 13 A star's placement on an H-R diagram indicates its absolute brightness and surface temperature (or color).
Interpreting Diagrams Compare the sun and Aldebaran. Which is hotter and which has a greater absolute brightness?
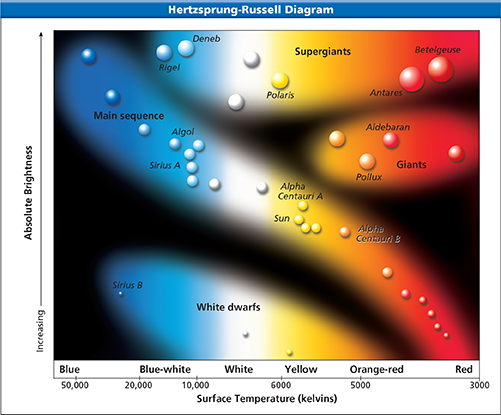
The Hertzsprung-Russell Diagram
In the early 1900s, two astronomers working independently, Ejnar Hertzsprung and Henry Norris Russell, made a similar observation. Both discovered that stars can be classified by locating them on a graph showing two easily determined characteristics. Such a graph is called a Hertzsprung-Russell diagram, or H-R diagram. An H-R diagram is a graph of the surface temperature, or color, and absolute brightness of a sample of stars. These diagrams are one of modern astronomy's most important tools.  H-R diagrams are used to estimate the sizes of stars and their distances, and to infer how stars change over time.
Look closely at the H-R diagram in Figure 13. The horizontal axis shows the surface temperatures of stars. Recall that a star's color is directly related to its surface temperature. The hottest blue stars are on the left and the coolest red stars are on the right. Surface temperatures of stars range from less than 3000 K to more than 30,000 K.