In Figure 16, a state of matter is listed at each corner of the triangle. Each arrow in the diagram represents a different phase change. Each pair of arrows represents a set of reversible changes. For example, the arrow starting at the solid phase and ending at the liquid phase represents melting. The arrow starting at the liquid phase and ending at the solid phase represents freezing.
Figure 16 This diagram lists six physical changes that can occur among the solid, liquid, and gaseous phases of a substance. Interpreting Diagrams Explain why the changes are grouped into the pairs shown on the diagram.
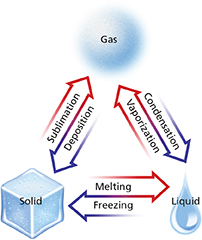
 Melting, freezing, vaporization, condensation, sublimation, and deposition are six common phase changes. All phase changes share certain characteristics related to energy and temperature.
Temperature and Phase Changes
One way to recognize a phase change is by measuring the temperature of a substance as it is heated or cooled. The temperature of a substance does not change during a phase change.
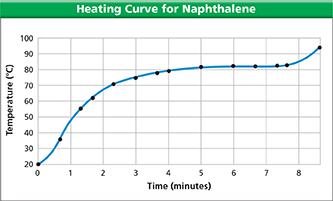
Naphthalene (NAF thuh leen) is a compound that is sometimes used in mothballs. Figure 17 is a graph of the data collected when a solid piece of naphthalene is slowly heated. Temperature readings are taken at regular intervals. At first the temperature rises as the solid naphthalene warms up. But at 80°C, the temperature of the naphthalene stops rising. The temperature remains at 80°C, which is the melting point of naphthalene, until melting is complete.
If liquid naphthalene is placed in an ice-water bath, the temperature of the liquid will drop until it reaches 80°C. It will remain at 80°C until all the liquid freezes. The temperature at which the substance freezes— its freezing point—is identical to the temperature at which it melts. The freezing and melting points of naphthalene are both 80°C.
If naphthalene is heated after it has completely melted, its temperature begins to rise again. The temperature keeps rising until it reaches 218°C, which is the boiling point of naphthalene. Until boiling is complete, the temperature remains at 218°C.
Figure 17 This graph shows what happens to the temperature of a solid sample of naphthalene as the sample is slowly heated.
Using Graphs What happened to the temperature in the interval between four and seven minutes?
 d
d