Graphic Organizers
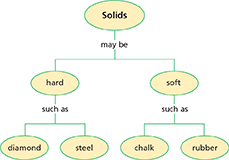
Concept Maps and Web Diagrams
A concept map is a diagram that contains concept words in ovals and connects the ovals with linking words. Often the most general concept is placed at the top of the map. The content of the other ovals becomes more specific as you move away from the main concept. Linking words are written on a line between two ovals.
A web diagram is a type of concept map that shows how several ideas relate to one central idea. Each subtopic may also link to subtopics, creating the visual effect of a spider web. Linking words are usually not included.
Compare-and-Contrast Tables
A compare-and-contrast table is a way of showing the similarities and differences between two or more objects or processes. The table provides an organized framework for making comparisons based on specific characteristics.
The items to be compared are usually column headings across the top of the table. Characteristics for comparison are listed in the first column. You complete the table by filling in information for each item.
Contents |
Book |
CD-ROM |
|---|---|---|
Paper pages |
Yes |
No |
Photographs |
Yes |
Yes |
Videos |
No |
Yes |
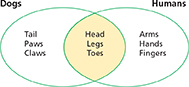
Venn Diagrams
A Venn diagram consists of two or more ovals that overlap. Each oval represents a particular object or idea. Unique characteristics are shown in the part of each oval that does not overlap. Shared characteristics are shown in the area of overlap.
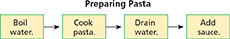
Flowcharts
A flowchart is used to represent the order in which a set of events occurs. Each step in the sequence is described in a box. Each box is linked to the next box with an arrow. The flowchart shows a sequence from beginning to end.
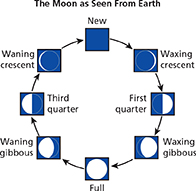
Cycle Diagrams
A cycle diagram shows boxes representing a cyclical sequence of events. As in a flowchart, boxes are linked with arrows, but the sequence does not have a beginning or end. The boxes are usually arranged in a clockwise circle.