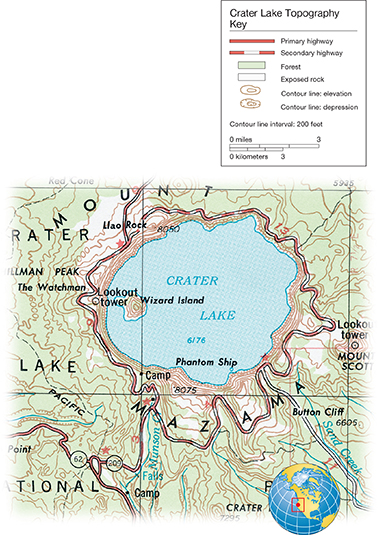
Topographic Maps

Topographic maps provide information on the elevation, relief, and slope of the ground surface. A topographic map uses contour lines to show you the surface features of an area as if you were looking down on them from above. Each contour line on the map connects points of equal elevation. Closely spaced contour lines show steep slopes. Widely spaced contour lines show gentle slopes or flat areas.

▴ Contour Lines

In the topographic map of Crater Lake National Park, closely spaced contour lines surrounding the lake represent steep slopes along the lake's perimeter. For this map, the contour interval, or the change in elevation from one contour line to the next, is 200 feet.
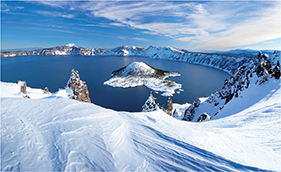
Photo of Crater Lake that is icy and covered in snow.

▴ Crater Lake

Located in southwestern Oregon, Crater Lake has an average surface elevation of 6176 feet (1882 meters) above sea level. At the west end of the lake lies Wizard Island, which rises to 764 feet (233 meters) above the water.

Map of Crater Lake with contour lines on a grid along with the key to the map.

End ofPage 892

Table of Contents

Physical Science CHAPTER 1 Science Skills CHAPTER 2 Properties of Matter CHAPTER 3 States of Matter CHAPTER 4 Atomic Structure CHAPTER 5 The Periodic Table CHAPTER 6 Chemical Bonds CHAPTER 7 Chemical Reactions CHAPTER 8 Solutions, Acids, and Bases CHAPTER 9 Carbon Chemistry CHAPTER 10 Nuclear Chemistry CHAPTER 11 Motion CHAPTER 12 Forces and Motion CHAPTER 13 Forces in Fluids CHAPTER 14 Work, Power, and Machines CHAPTER 15 Energy CHAPTER 16 Thermal Energy and Heat CHAPTER 17 Mechanical Waves and Sound CHAPTER 18 The Electromagnetic Spectrum and Light CHAPTER 19 Optics CHAPTER 20 Electricity CHAPTER 21 Magnetism CHAPTER 22 Earth's Interior CHAPTER 23 Earth's Surface CHAPTER 24 Weather and Climate CHAPTER 25 The Solar System CHAPTER 26 Exploring the Universe Skills and Reference Handbook