After all the ice has melted, make five more measurements of the temperature at oneminute intervals. Turn off the hot plate.
Graph your data with time on the horizontal axis and temperature on the vertical axis.
Part B: Heating Lauric Acid
Empty the water from the beaker into the sink. Fill the beaker halfway with cool tap water.
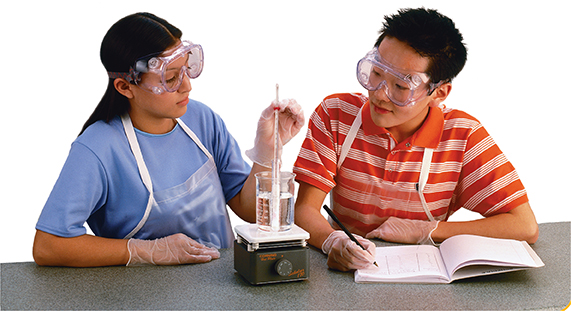
Place a test tube containing lauric acid and a thermometer into the beaker. If necessary, add or remove water from the beaker so that the surface of the water is above the surface of the lauric acid but below the opening of the test tube.
Place the beaker on the hot plate. After 20 seconds, measure the temperature of the lauric acid. Record this temperature next to the 0 minutes entry in your data table.
Repeat Steps 4 through 7 using the lauric acid instead of the ice. To keep the temperature the same throughout the water bath, use the glass stirring rod to stir the water after you take each temperature measurement.
Analyze and Conclude
Using Graphs Describe the shape of your graph for ice.
Analyzing Data What happened to the temperature of the ice-water mixture during the phase change?
Drawing Conclusions What happened to the energy that was transferred from the hot plate to the ice during the phase change?
Comparing and Contrasting Compare the shapes of the graphs for ice and for lauric acid. Compare the melting points of ice and lauric acid.