


 Standardized Test Prep
Test-Taking Tip
Analyzing Data
Some test questions are based on graphs. Take about 20 seconds to scan the graph. Read the labels. Describe the graph to yourself. The graph gives information on wavelength, from shorter to longer, and frequency, from lower to higher. Use the information to select which choice best answers the question.
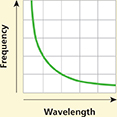
What relationship is represented by the graph?
Frequency is directly proportional to wavelength.
Frequency is inversely proportional to wavelength.
Comparing wavelength and frequency shows photon energy.
Waves with lower frequencies and longer wavelengths exhibit the photoelectric effect.
Wavelength is greater than frequency.
(Answer: B)
Choose the letter that best answers the question or completes the statement.
In order of increasing frequency, the electromagnetic waves are radio waves, infrared rays,
microwaves, visible light, X-rays, and gamma rays.
visible light, ultraviolet rays, X-rays, and gamma rays.
ultraviolet rays, X-rays, visible light, and radar.
gamma rays, X-rays, ultraviolet rays, and visible light.
gamma rays, X-rays, visible light, and ultraviolet rays.
A light source that emits light partly because of its phosphor coating is
an incandescent bulb.
a tungsten-halogen lamp.
a neon tube.
a fluorescent tube.
a laser.
A material that reflects or absorbs all of the light that strikes it is
translucent.
opaque.
black.
transparent.
incandescent.
An electromagnetic wave in space has a frequency of . Its wavelength is
0.6 m. 6 m.
60 m.
600 m.
6000 m.
Both a source of red light and a source of blue light shine on a metal, as shown in the diagram below.
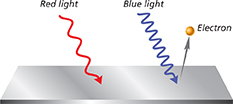
What scientific concept does the diagram represent?
interference
the photoelectric effect
polarization
diffuse reflection
refraction
Why was no electron emitted when the red light hit the metal?
Photons of red light have too little energy.
There were not enough photons available.
All electrons had already been emitted when the blue light hit the metal.
Red light is absorbed by metal.
Red light is reflected by metal.