


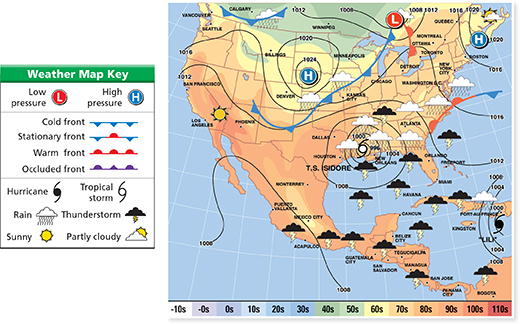
Figure 29 The isobars on this weather map encircle the centers of low-pressure and high-pressure systems. You can also see a cold front, a warm front, and a stationary front as well as a hurricane and a tropical storm.
Interpreting Visuals According to the weather map, what are the weather conditions in New Orleans, Louisiana?
 d
d
High-Speed Computers
High-speed computers help meteorologists compile and analyze the tremendous amount of weather data collected every day. With these data, scientists make both short-term and long-term forecasts. How accurate are these forecasts? Most forecasts can be quite accurate in the short term, from 12 hours to 3 days. Meteorologists can also accurately forecast the movement of large weather systems, such as cyclones, over a period of 3 to 7 days. Predicting beyond a week, however, remains extremely difficult, even with modern technology. The movement of weather systems depend on too many variables for meteorologists to forecast the weather reliably over longer periods.

How accurate are most weather forecasts?
Weather Maps
To help analyze weather data, meteorologists make maps that show weather patterns of different regions. You've probably seen weather maps in newspapers or on TV weather reports.  Weather maps typically show predicted temperatures and include sun or cloud symbols to indicate cloud cover. They have drawings of rain or snow to show areas of precipitation. They also usually include symbols for the different kinds of fronts and areas of high and low pressure.